 Kaid Benfield Archive
 New urbanists show us the numbers for smart growth

Posted January 25, 2008 at 10:09PM
Hello. My name is Kaid and I’m a new urbanist. (All together, now: “Hello, Kaid.”)
No, really. New urbanists - members of the school of architecture and planning that advocates compact, walkable, mixed-use communities - catch some grief in the circles I travel in, mostly for being elitist and, some claim, actually not-so-new suburbanists. But it’s a bad rap for the most part, if not entirely. And, at a recent meeting on green design hosted by the Congress for the New Urbanism, a number of presenters trotted out some impressive numbers illustrating the potential of well-placed, compact, mixed-use development to reduce greenhouse gas emissions.
As I wrote in an earlier post, these were the guys and women who started me on the path of trying to help solve sprawl at NRDC. After reading some of their work, I found my way to CNU soon enough, and even served as chair of their environmental task force for about five years. Although that particular position was all task and no force, and one that I do not miss, it led me to Doug Farr, who became my partner along with folks from the US Green Building Council in creating LEED for Neighborhood Development, and to all sorts of other very good friends and professional partnerships. Frankly, a higher percentage of the CNU constituency gets it about smart growth’s potential to solve environmental problems than do people in the environmental movement. They have been ahead of us on this.
 The meeting on green design is well-reported in the current issue of New Urban News, an excellent trade publication. I’ll recount some of the best of what’s in their January/February issue here. All of the graphs are from that issue.
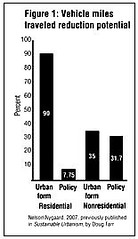
At the risk of being way too nerdy with the numbers and graphs, here goes: The first graph, next to a photo of the new urbanist development Issaquah Highlands near Seattle, represents the findings of a 2005 analysis by Nelson/Nygaard consultants that examined the effect of land use changes on automobile trips. In particular, it estimated the combined potential reduction in auto trips presented by a bundle of smart-growth characteristics including residential density, mixed uses, local-serving retail, transit, and a friendly environment for walking and bicycling.
The bar on the far left in the graph shows the dramatic potential of the bundle to reduce auto trips to and from single-family housing, according to the researchers' findings, by as much as 90% per household. The third bar from the left represents the potential of a similar set of smart-growth elements that, says the analysis, could reduce automobile trips to and from non-residential locations by as much as 35%. In both cases, the bundle of land-use characteristics outperformed a combination of “transportation demand management” strategies including regulating the supply and price of parking, free transit passes, and telecommuting. The comparative potential of the TDM strategies is represented by the second and fourth bars for residential and non-residential development, respectively.
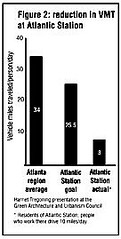

 These findings are consistent with those emerging from a study of transportation patterns at Atlantic Station, the smart-growth “city within a city” in midtown Atlanta. Atlantic Station has been very exciting to those of us who follow these things, because it combines so many of the elements we advocate, including major brownfield conversion, a great in-town location, compactly arranged housing and commercial space, lively shopping and entertainment, green building, and green space with parks, a lake, and trails. It has justly earned all sorts of awards. Atlantic Station required a special dispensation from the federal EPA to be built, because of Atlanta’s woeful air-pollution situation at the time, and its proponents introduced predictive studies allowing the agency to proceed on the basis that the development would reduce vehicle miles traveled by 25% or more compared to the Atlanta regional average.
The development appears to be beating that goal easily. As the graph above indicates, residents of metro Atlanta drive a sobering 34 miles per day per capita, represented by the bar on the left (this per capita average includes children, elderly, and others who don’t drive at all!). The early results from Atlantic Station indicate that its residents, by contrast, drive only 8 miles per day, 24% of the regional average, as presented by the bar on the far right; workers in Atlantic Station drive only 10 miles per day, on average. (The center bar shows the original driving reduction goal for the development.) The convenient solution to the inconvenient truth, indeed.
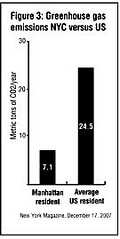
 Taken to an urban extreme, New York City research is also consistent with these findings. The NYC graph, left, compares the average amount of greenhouse gas emissions generated per resident in New York's Manhattan to the national average. In compactly designed, transit-rich, highly walkable Manhattan, the number is only 29% of the national average, measured in metric tons of carbon dioxide per year. These findings, attributed in New Urban News to a recent article in New York magazine, are further consistent with a wonderful article by David Owen in the October 18, 2004 edition of the New Yorker titled “Green Manhattan.” Owen points out that, if New York City were to become the 51st state (I’m sure that would be just fine with many upstate NY residents), it would rank 51st in per capita energy use. He also points out that Phoenix, with roughly half the population of Manhattan, occupies 200 times as much land. (You can read an excerpt here.)
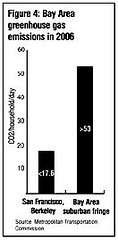
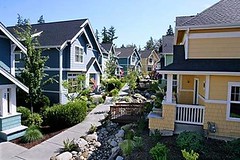
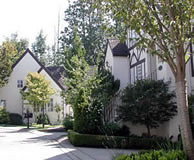
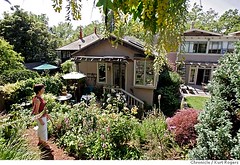 The fourth graph (my friend Merry must be really pleased; she likes my wonkiest posts the best) makes a similar comparison, but this time it compares city to suburbs in the San Francisco Bay Area. The findings? Residents of the city of San Francisco and Berkeley generate about 17.6 pounds of carbon dioxide per household per day. On the suburban fringe, that number jumps to over 53 pounds per household per day, about three times that of the urban dwellers. Put another way, sprawl sends greenhouse gas emissions through the roof. And note, as the photo of a residential neighborhood in Berkeley illustrates, you don’t need Manhattan densities to achieve the lower level.
Carbon reduction, of course, is not the only benefit of smart growth. We also get walkable convenience, shorter driving distances and times, much less land consumption and pressure on important natural, historic, and scenic resources, more preserved forest and farmland, and reduced stormwater runoff.
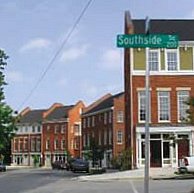
 The point about not needing Manhattan (or even midtown Atlanta or downtown San Francisco) densities is an important one. We frequently support our case with research and data from larger cities, but the results may be extrapolated to smaller cities and communities as well. With this paragraph are examples of very smart, yet livable, densities in Greensboro, North Carolina and Portland, Oregon, respectively. The changes that we need are profound (compared to sprawl) but by no means drastic. In fact, smart growth is our heritage: true sprawl largely didn’t exist in the US as recently as 60 years ago.
Turning to a closely related subject, the same issue of New Urban News also contains a feature story on our Cool Spots project, which I reported on some time back. Cool Spots is an emerging GIS-based model that will identify places where development is likely to have the lowest per-capita carbon footprint. Read the story here.
As for CNU’s green meeting, which they called a “council” (did they have Jeff Probst, torches and a bonfire?), they didn’t even invite me to participate. In fact, there was no one from the mainstream environmental community invited on the agenda of what was purportedly an environmental meeting. I’m still miffed about that. (And so much for my attempt to bring the two communities together when I was working with the task force.) I think they basically just forgot, or maybe they are annoyed that I’m now hanging out on an AIA committee instead of one of theirs. (As a policy wonk and lawyer rather than architect or planner, I'm an interloper in either case.) But that’s OK; they are still my friends and allies. And they came to the right conclusions, and not for the first time.
I'm going to have to be really less wonky next time. I promise.