 Kaid Benfield Archive
 Inside NRDC's new smart growth web feature: how it works

Posted January 16, 2009 at 2:00PM
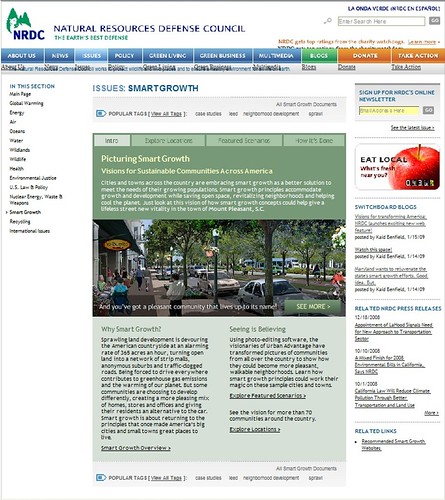
Yesterday, I was honored to announce the launch of NRDC's new interactive smart growth website, Picturing Smart Growth. Here's a little about how it works.
When you click on the main link, you'll be taken to this introductory screen:
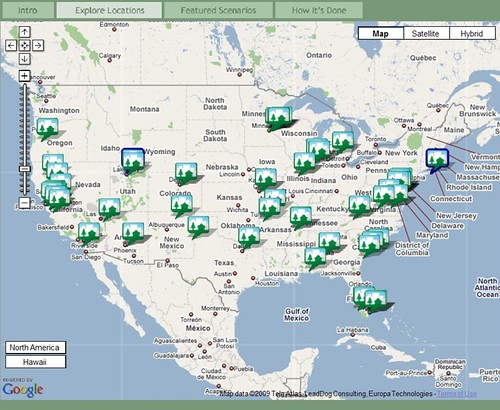
You have a number of tabs and options, but many people will want to go first to Explore Locations, which brings up this map of the US, with icons showing the various site locations where we feature smart growth transformation scenarios:
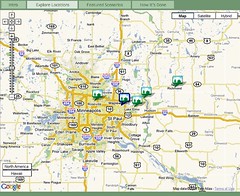
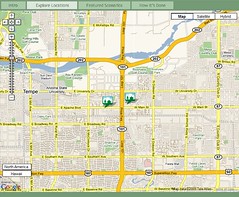
You can search just below the map by category, which I'll return to. But let's say you are curious about what we have in the Twin Cities or Phoenix area. Zoom in on them, one at a time. You have to zoom quite a bit to know that there are, for example, five locations in the Twin Cities, and two in metro Phoenix (actually in Tempe), as shown below:
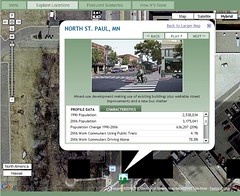
Move the cursor over each, and you'll see the exact community where each is located. For example, second from the left on the Twin Cities zoom is a site in North St. Paul. Click on it, and you'll bring up details on that location, as shown on the left below. The pop-up gives you the transformational slide show from existing conditions to completed project, along with some context for the metro area, such as population growth and recent commuting trends. (Note that the data are for the whole metro area, not just North St. Paul.). There is also a tab in the pop-up indicating which characteristics we are illustrating with that site.
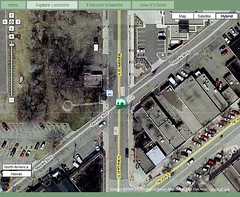
Close the pop-up, and you'll get a satellite image of the exact location of the scenario, as shown on the right:
There is a bunch more you can do. Go back to the Explore Locations tab, for example, and zoom back out to get the full map of the US. Just below the map are some check boxes you can use to look for scenarios with certain characteristics. For example, in the one below, I was looking for suburban strip development that was shown converted into a mixed use development with walkable streets:
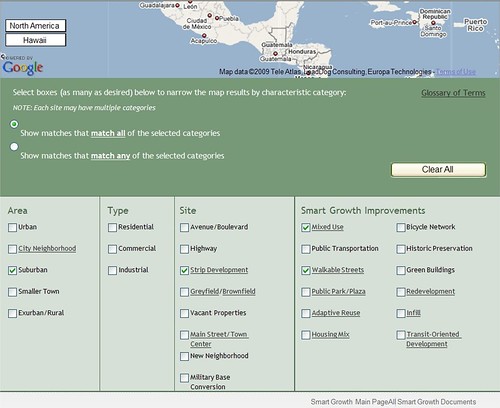
Each time I checked a box, it affected the map so that after I had checked all four categories, the map showed only the dozen or so sites that illustrated all of those characteristics. Cool, yes?
There's lots more, including our five Featured Scenarios, and our How It's Done page explaining how Steve Price and our partner Urban Advantage work their transformational magic. Please roam around the site, enjoy, and let us know what you think.
A lot of people spent a lot of time making this happen, including Rita, Rachel, Scott, Will, and Kim, shown below. (I wanted to show Steve, too, but he is so good at hiding his photo from the Internet masses that I couldn't find him, assuming he isn't moonlighting as a pro rugby player for the New Zealand Warriors.) They have done a fabulous job with this project, and all of them are consummate pros and absolute pleasures to work with:


Thanks also to our communications czar Phil, of course, for his support of this project and all the other mischief I weave on this corner of the web.