 Kaid Benfield Archive
 The United States of Transit Cutbacks

Posted March 16, 2009 at 1:44PM
")
One of the sad ironies of our time is that, as demand for public transportation is soaring to levels not seen in 50 years, the recession has dampened government support for transit. Another sad irony is that, just as the federal stimulus is pumping (needed) money for new transit start-ups, it is doing nothing to bolster existing operation and maintenance costs. The result is an epidemic of transit service cutbacks across the country.
In these maps compiled by Transportation for America (click on them for the interactive versions), the colors indicate the following:
- yellow indicates service cuts;
- green indicates fare increases;
- purple indicates both service cuts and fare increases;
- red indicates both service cuts and job losses;
- turquoise indicates both fare increases and job losses; and
- $ indicates a devil's trinity of service cuts, job losses, and fare increases.
Go to the interactive versions and you can move the map around and zoom in on particular locations, like so:
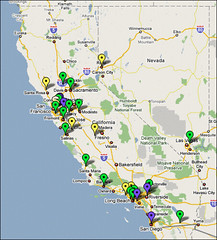
There is a running table to the left of the interactive map detailing the particular circumstances of each of the 80 locations depicted. (For example, service may be cut by 16 percent in Albuquerque; fares have been raised 20 percent in Charleston; 600 transit jobs are being eliminated in St. Louis.) The map was last updated on March 2. The sites for Reconnecting America and Transportation for America have much more context for those who are interested.