Massive database provides a wealth of information to support transit-oriented development

Posted October 18, 2010 at 8:08PM
This just in:
The Center for Transit-Oriented Development (CTOD) today launched a web database that provides comprehensive information about more than 4,000 transit zones across the United States. The web tool will help developers, investors, and city officials make planning decisions that take advantage of development opportunities around transit nodes.
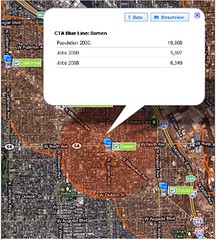
In particular, the TOD Database, available here, provides extensive information on land use density, resident demographics and occupations, transportation habits of households and more near 4,160 existing and proposed transit stations, including commuter rail, streetcars, light rail, bus rapid transit and ferries.  The newly available tool allows users to view maps of various transit regions and choose a variety of data reports for stations of interest. Users can also query data by geography or demographics.
Data are available at three geographic levels: the transit zone (the 1/2 mile or 1/4 mile buffer around the individual station), the transit shed (the aggregate of transit zones), and the transit region (aligns with the Metropolitan Statistical Area boundary). The database synthesizes over 40,000 variables derived from nationally available data sets including the 2000 Decennial Census, the Census Transportation Planning Package, and Longitudinal Employment Data.
The effort was funded by the Federal Transit Administration, whose “goal is to partner with communities that want to develop smart transportation solutions that will inspire new economic development, reduce congestion and our dependence on oil, and help connect people with work, school, or the doctor’s office,” said Therese McMillan, deputy administrator of the FTA in a press release. “Having the best data available at your fingertips will help cities, neighborhoods, and developers, achieve the goal of a more livable, walkable community that benefits all of their residents.” An earlier version of the database was funded by the federal Department of Housing and Urban Development.
“We created the TOD Database as a one-stop shop for information on TOD to encourage more transit-focused communities in the marketplace,” said Scott Bernstein, president of the Center for Neighborhood Technology, one of the three sustaining partners in the Center for Transit-Oriented Development.  “We’ve provided research on 4,160 transit-centered opportunities for smart development decisions that are good for people’s pocketbooks and the economy.”
“The web-based TOD Database is an exciting step for us,” said CTOD Director Sam Zimbabwe. “In the six-year history of the partnership, we have always sought to empower good decision-making and sound investment by communities large and small. We’re excited to take this step and look forward to incorporating more information over the next year as it becomes available through the U.S. Census.”
I’ve written often on transit-oriented and transit-accessible development (for example, on design; on performance, and on case studies). It’s critical to sustainability, and I have known about precursors to this database at CTOD for years. I have long wished that it were publicly accessible and am thrilled to learn that it now is. The amount of work going into today’s release must have been enormous.
The CTOD is dedicated to providing best practices, research and tools to support equitable, market-based transit-oriented development. CTOD is a partnership of Reconnecting America, the Center for Neighborhood Technology, and Strategic Economics.
Move your cursor over the images for credit information.