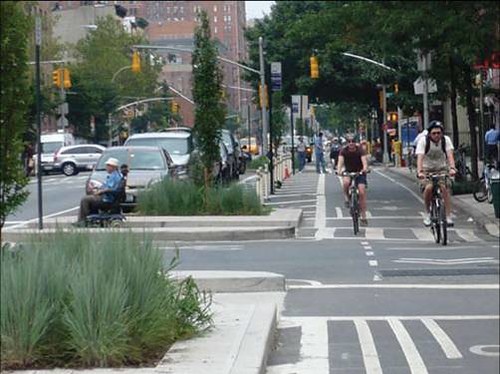
We're driving less, taking transit more. Now let's invest accordingly.

Posted December 5, 2013 at 7:14PM
A comprehensive new analysis of government data demonstrates that Americans are driving less per person, and taking transit more, both overall and in a strong majority of our large metro areas. Especially because the new report is consistent with a multitude of information showing changes in living patterns and lifestyle preferences, we should shift more public resources into transit, to keep up with and strengthen the trends toward more sustainable modes of transportation.
This is not to say that a majority of Americans don’t drive (including yours truly, to an extent), of course; we’ve built so much sprawl that many people have little choice. But we are becoming more multi-modal every day. We need to evolve our communities so that they become more suited to alternative modes, including walking and bicycling as well as transit, so that more Americans have more choices. And, where options do exist, we need to support and maintain them better in order to reduce carbon emissions, other forms of pollution, and automobile-dependent land uses.
Here are some highlights from Transportation in Transition: A Look at Changing Travel Patterns in America’s Biggest Cities, released Wednesday by U.S. PIRG, a national consumer advocacy organization:
- In aggregate, Americans are driving 7.6 percent fewer miles per year than they did in 2004. Indeed, the average number of vehicle miles traveled (VMT) per capita declined in 54 out of the 74 large urbanized areas whose trends could be analyzed between 2006 and 2011, according to the report. (The study examined 100 regions, but acknowledges that driving trend data for some could not be analyzed because data were not sufficiently standardized or timely.)
- The number of passenger miles traveled per capita on public transit increased in 60 out of the 98 large regions whose trends could be analyzed between 2005 and 2010.
- The proportion of workers commuting by private vehicle – either alone or in a carpool – declined in 99 out of 100 of America’s largest urbanized areas between 2000 and 2007-2011.
 The proportion of residents bicycling to work increased in 85 out of 100 of America’s largest urbanized areas between 2000 and 2007-2011.
- The proportion of households without cars increased in 84 out of the 100 largest urbanized areas from 2006 to 2011. The proportion of households with two cars or more decreased in 86 out of the 100 largest urbanized areas from 2006 to 2011.
The report examined whether variations in the economy could explain variations in trends in driving among urbanized areas, and found that they did not. In fact, the authors discovered that the economies of regions with large declines in driving were less affected by the recession than average regions, according to unemployment and poverty indicators. For example, the average increase in the unemployment rate in the 15 urbanized areas with the highest per-capita declines in VMT was 3.9 percent, while the average increase in all other urbanized areas was 4.6 percent.
Among the regions examined, New Orleans saw the largest drop in per-capita VMT – 22 percent – since 2006, possibly a result of Hurricane Katrina. The regions containing two Wisconsin cities, Milwaukee and Madison, saw the second and third biggest drops in per-capita VMT – 21 percent and 18 percent, respectively. Two Pennsylvania regions, Harrisburg and Pittsburgh, saw the fourth and fifth biggest drops in per-capita VMT – 14 percent and 13 percent, respectively.
The authors also found that the proportion of residents working from home has increased since 2000 in all of the nation’s 100 largest regions. Writing in The Washington Post, Ashley Halsey III reports that the observed drop in driving has occurred “as teleworking from home increases, baby boomers enter retirement, car ownership and the percentage of people with driver’s licenses drop, and the cost of gasoline remains high.”
Halsey continues:
“For almost 35 years beginning in 1970, Americans drove more miles each year and urban congestion spurred expansion of beltways and crosstown expressways. But since about 2004, the increase slowed and then reversed itself.
“Since then, the number of cars per licensed driver has decreased by 4 percent; the percentage of driving-age people who have licenses has dropped to its lowest in 30 years; and new technology has made working from home an option chosen by more people in every city the report surveyed.
“The Federal Transit Administration recorded a 20 percent jump in the number of people using public transportation in the first 11 years of the 21st century.”
New York and Washington, DC saw the biggest drop in commuters getting to work by car, 4.8 and 4.7 percent respectively. The DC area saw a comparable overall decrease in VMT between 2006 and 2011, while its transit ridership increased 7 percent. I might add that this is despite a troubling decline in the reliability and comfort of local transit service, particularly on Metrorail. This report provides strong support for increased spending on transit, not only in service expansion but for maintenance, which has been neglected in recent years.
Related posts:
- We need more driving-optional neighborhoods (excerpted from People Habitat) (November 18, 2013)
- How LEED-ND standards reduce driving and associated emissions: new research (June 12, 2013)
- New DC data confirm real estate recovery strongest in central & transit-served locations (March 26, 2013)
- The fascinating visual rhythms of regional transit (December 6, 2012)
- New evidence that smart growth may reduce local congestion as well as overall driving (June 8, 2012)
- Promoting people-oriented development around transit (May 21, 2012)
- New data show how transit corridors reduce traffic, increase walking (August 17, 2011)
- Households in transit-oriented locations save more energy and emissions than even 'green' households in sprawl (February 24, 2011)
Move your cursor over the images for credit information.
