The Smarter Cities project would like your help in improving its criteria for ranking US cities

Posted August 10, 2009 at 1:36PM
As some of you probably know, Smarter Cities is an initiative that ranks US cities on a number of key sustainability criteria as well as on overall sustainability. The system has been developed, managed and staffed independently of NRDC, but several months ago our organization agreed to host it on our website. Now that the system has been re-launched as a project of NRDC, we would very much like your input on how to improve the rankings criteria.
 The criteria that were used in the recently published rankings are here, and the evolving criteria that are being proposed for the next round of rankings are here. You may email your thoughts directly to the Smarter Cities team at smartercities@nrdc.org, or you may participate in the CityWiki, which was established online just last week as an exercise in participatory environmentalism. The CityWiki lists the proposed criteria for the next round and is structured to receive input on each criterion (note that the proposed list differs in some respects from the one used last year), alternative methods of city comparison, and weighting and scoring. You will need to go through an easy login process to participate, but it will be a very effective way of registering your thoughts.
I would also be interested in reading your thoughts here in this blog if you're willing to share them. (Beyond the rankings, criteria, and wiki, the Smarter Cities site also hosts a blog, a "citizen reporters" section that invites outside participation, a "city stories" section of profiles and issue commentary, and more.)
In the past round, each city was scored on 10 issues, which were equally weighted in the overall rankings. These were air quality, energy production and conservation, "environmental standards and participation," green building, green space, recycling, transportation, "standard of living," and water quality and conservation A threshold question to consider is whether these are the right categories and, if so, should they remain equally weighted?
 The scores were then compared to each other in three groupings according to population (large cities of 250,000 or more, medium from 100,000 to 250,000, and small for under 100,000). It has been the project's ambition to score every US city of 50,000 or greater population, over 600 in all. Of the large cities, Seattle, San Francisco, and Portland made it a clean sweep for the Pacific coast in the top three overall spots. Coming in last among the 67 large cities were Anchorage, Alaska; Islip, New York; and Lexington, Kentucky.
For the various issue categories, the rankings were based on a combination of reported performance data and responses to a broad questionnaire sent to an environmental official in each city. For illustration, here is a closer look at a few of the issue categories and a bit about how they were scored, along with some of the results:
Air Quality: 7/10 of the score was based on where the cities ranked using EPA's Air Quality Index, and 3/10 was based on whether the city had smoke-free workplaces and restaurants. The top big city under these measures was Seattle; the worst was Charlotte. The best medium-sized city was Madison; the worst, Paterson, New Jersey. Interestingly, notoriously polluted Houston scored relatively well, bettering Tucson, St. Paul, and Raleigh; Los Angeles scored higher than Virginia Beach.
 Energy Production and Conservation: For this category, the largest portion of the score was based on the main sources of energy in each city, with points given for the presence of renewables and deducted for nonrenewables. 4/10 of the score was based on the questionnaire answers, with credit given for the presence of conservation programs and whether or not green power options are available to consumers through their local utilities. This put Seattle, Anaheim, and Dallas in the top 10 big cities, and Wichita last; Santa Rosa was the highest-ranking medium city; Elizabeth, New Jersey, the lowest. New York, which has the lowest per capita energy consumption in the country, ranked 27th among the 67 big cities, below Oklahoma City, Las Vegas, and #9 Dallas.
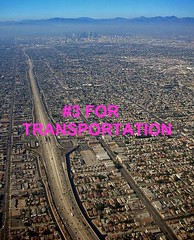
Transportation: 8/10 of the transportation scoring was based on the responses to the questionnaire sent to a city official. Cities were ranked by the number of "transportation options available to residents," such as "bicycle paths, bicycle sharing programs, bus systems, carpool lanes, car sharing, dedicated bicycle lanes, light rail, sidewalks/trails, subways and trolleys." 2/10 of the score was based on transit ridership. Among big cities, San Francisco ranked first and Lexington, Kentucky last; among the mediums, Santa Clarita, California was first and, again, Paterson last. Los Angeles, despite soaring rates of driving and the country's worst traffic congestion, ranked #3 under this methodology, outperforming Portland, New York, and Chicago.
 Standard of Living: These scores were based on a combination of median household income, the percentage of families living below the poverty line, the percentage of owner-occupied housing, and the National Association of Home Builders Housing Opportunity Index (HOI). San Jose ranked as the large American city with the best standard of living, New Orleans the worst. Among the mediums, Thousand Oaks, California ranked first and, sadly, Paterson was again last.
Environmental Standards and Participation: I believe this category was based entirely on the questionnaire responses, and cities were ranked according to how many municipal departments had environmental standards and/or public participation opportunities. Sacramento ranked first among the bigs, Lexington (again) last. (Why am I starting to think that Lexington's environmental officer simply failed to spend enough time on the questionnaire?) Among the mediums, Santa Rosa ranked first, Paterson (see comment above re Lexington) last.
NRDC sees this project as a beginning and a work in progress, and we really want to get it right. Among the things our team has learned so far is that, by and large, the media love rankings stories and, unsurprisingly, the cities that scored well are happy. Those that believe they should have scored higher are not so happy with the criteria. Among the online commentary, The City Fix DC was laudatory, while World Changing and Greater Greater Washington were among the critics.
Take a look, read the commentary if you like, make up your own mind, and let our Smarter Cities team know what you think. Personally, I am hoping that we can move away from the subjectivity of questionnaire responses as much as possible and toward reported performance data; and I am hoping we can use per capita performance measures rather than raw numbers. I also hope we can develop new categories on smart growth (such as density trends) and public health (such as obesity and major disease rates). I have been impressed with the openness of the team to suggestions, and your input will be vital to improvement.