Housing market strengthens for smart growth: dramatic new data from the DC area

Posted April 26, 2010 at 1:32PM
The housing market is trending ever more dramatically toward smart growth. A look at recent home sales data in the Washington, DC metro area shows how.
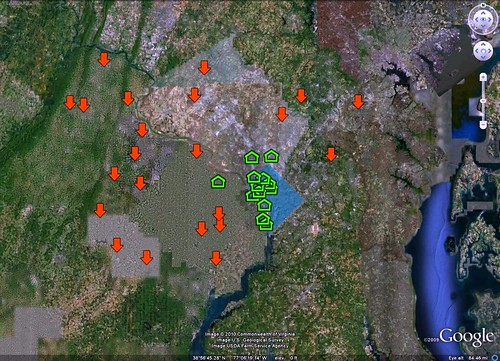
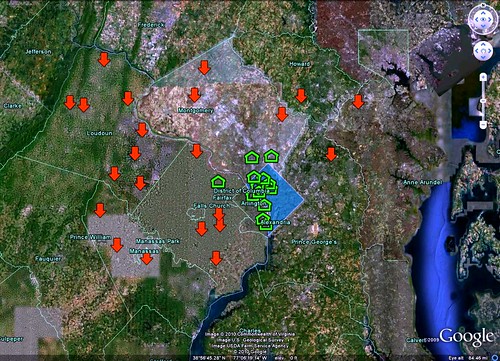
In particular, the May 2010 issue of Washingtonian magazine focuses heavily on the region's real estate. It contains a list of the 100 “golden zip codes” in the greater DC area that command the highest prices in home sales, indicating which have gone up or down recently in median sales price and by how much. I separated out a subset comprising two groups: those where median prices declined 25 percent or more during the last three years, and those where prices have gone up by any amount in the same three years.
I then indicated these areas on a Google Earth image of the region, marking the zip codes with 25% or more declines with red arrows, those showing increases with green house symbols. For orientatation, the area shaded in blue in the center of the map is the central city of Washington, DC. The area in dark blue along the right (eastern) edge of the map is the Chesapeake Bay. The blue river running south from DC is the Potomac.
The results display dramatically, as you can see. The images above and just below are identical, except that the one below also shows jurisdictional boundaries. You can see the outline of the city of Baltimore in the northeast corner of the map.
Basically, the only parts of the database that gained in value were in the central city of Washington and the close-in suburbs of Arlington, Alexandria, Bethesda, and Silver Spring, all nonsprawling and served by Metro rail transit. The one semi-outlier to the west of the city that showed a gain is Tysons Corner, Virginia, whose market has likely been influenced by a highly publicized urban makeover oriented around stations on a new Metro line, now under construction. It gained in value by 0.1 percent. The far western reaches of the region, which have experienced the most new sprawl development in the last decade, have suffered the most declines.
That close-in locations are favored by the market is not news, of course. On a per-square-foot basis, central locations are traditionally more prized by homebuyers. What is news is the movement in the market that is making the relative desirability of central locations, and the relative decline of the value of sprawl, much more pronounced.
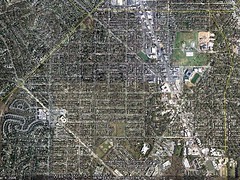
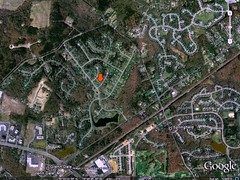
The biggest gainer in the database was DC's Tenleytown/Palisades zip code 20016 (above left, sample Walk Score: 80), at 29 percent. Tied for the biggest loser at -44 percent were zip codes 20112 (sample Walk Score: 8) near Manassas, Virginia, to the city’s far southwest, and 20769 (above right, sample Walk Score: 11) near Glenn Dale, Maryland, to the northeast. Though Glenn Dale is somewhat closer to DC, both are sprawling, automobile-dependent areas. The two images just above are shown at the same scale.
Because I focused on the extremes of the market, my regional images do not contain markers for in-between places such as Crownsville, Maryland (-20 %); DC’s Shaw (-7%); Mount Vernon, Virginia (-12%); or Fairfax 22031, Virginia (-7%). In addition, the magazine's database eliminated entirely any zip codes with fewer than 50 home sales in the past year.
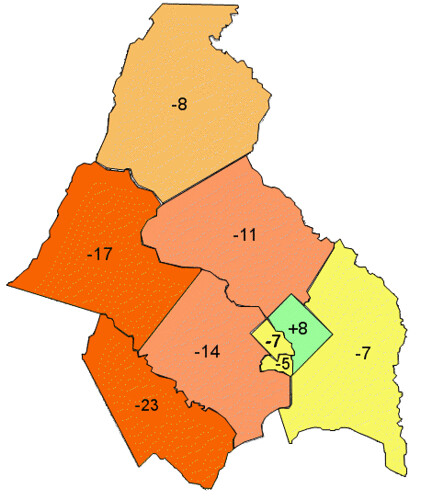
The new map is consistent with one I built about a year ago (above), showing only county-level data and only one year’s worth of price change data (for 2008).
We’ve seen similar evidence of market changes all across the country, but in this area it really could not be more clear that the market is moving strongly toward the same locations that the environment favors. Those who continue to believe in sprawl (including leapfrog "urbanism” on rural land) are destined to keep losing money.
