Brilliant use of GIS to show impacts of discrimination, disinvestment & sprawl

Posted October 27, 2010 at 1:32PM
University of Iowa historian Colin Gordon has produced an amazing series of maps of metropolitan St. Louis, showing geographic patterns over time related to four categories: white flight; race and property; municipal zoning; and ‘urban renewal.’ There are 28 maps in all, some of which can be combined into hybrids.
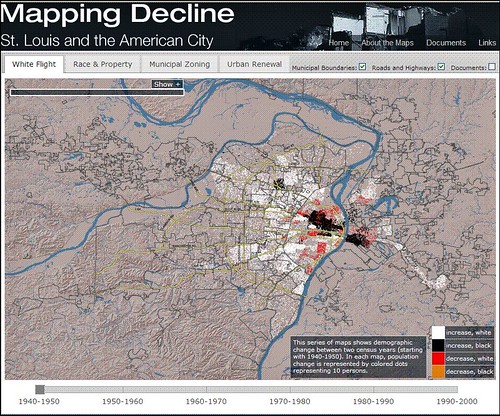
Above, for example, is a map showing demographic change in the 1940s. The pattern of an urban core populated by African Americans, surrounded by suburbs dominated by whites was already becoming clear: areas marked with white dots experienced a gain in white population; areas marked with black dots experienced a gain in African American population; areas marked with red dots experienced a decrease in white population.
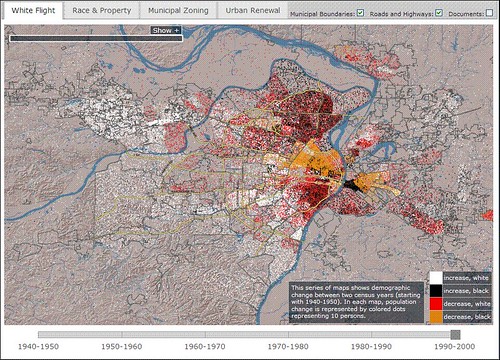
Immediately above, to the same scale, is a map showing changes occurring fifty years later, in the 1990s. Notice how far the increases in white settlement had spread; the core was now declining for both whites and African Americans. (Amber dots indicate a decrease in African American population.) In addition, African Americans were settling, and whites were fleeing, the northern suburbs.
Gordon explains the project:
“This web project accompanies the book Mapping Decline: St. Louis and the Fate of the American City (PennPress, 2008). It presents four interactive series of maps, each touching on a major theme developed in the book. After you hit the “go to maps” button, these series will appear as four tabs. Each series is animated by a chronological slidebar, or a menu of map layers. Each series also includes a selection of documents, linked from the maps or the accompanying text boxes. These can also be found on the “documents” page.”
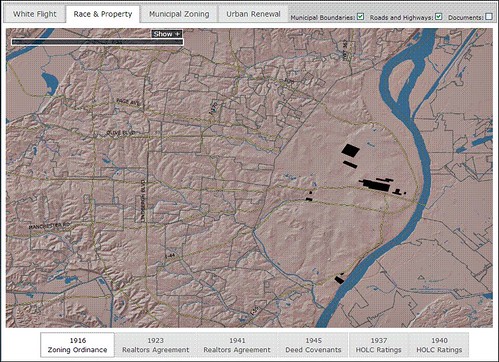
This pattern of racial settlement in and around St. Louis did not happen by accident: Immediately above is Gordon’s map showing the effects of a 1916 St. Louis zoning ordinance establishing “Negro blocks” within the city. This was an early-20th-century act of legally established racial segregation in the city.
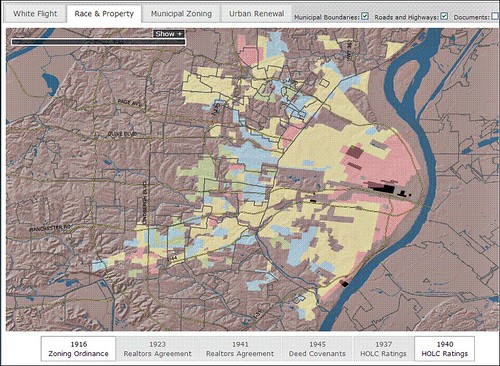
The map below shows the impact of the federal Home Owners’ Loan Corporation’s (a sort of precursor to Fannie Mae) classification of areas of the region according to perceived mortgage risk. In the HOLC’s 4-color code, the green areas were designated ‘best’; blue, ‘still desirable’; yellow, ‘definitely declining’; and red, ‘hazardous.’ Thus, the term ‘redlining.’ The map represents the zones as of 1940:
Gordon’s maps also indicate the effect of other legal or quasi-legal acts of discrimination over time, including two agreements among the members of the St. Louis Real Estate Exchange, areas where discriminatory covenants were embedded in deeds, and an earlier survey by the HOLC. A third series of maps illustrates the geography over time of various ‘urban renewal programs,’ and yet another series maps municipal zoning districts over time according to whether areas were restricted to commercial, industrial or residential use, the residential category further divided into multi-family, small-lot, medium-lot, and large-lot districts, essentially mandating degrees of sprawl.
Gordon includes lots of explanatory material, presented in interactive form. If, like me, you love maps, you’ll be as fascinated by the presentation as troubled by the content. Now I want to get the book, too. And, even if you aren’t a map junkie you’ll learn a lot about a disturbing legacy in America that we must still work hard to overcome. I do think we’re making progress, but the road is long, with many a winding turn.
I highly recommend going to Gordon’s site, Mapping Decline, and spending some time there. Many thanks to Mary Means for first pointing me to it.
By the way, this week marks the third anniversary of this blog. 692 posts into the process, I am still enjoying it, and I hope readers are, too.
Move your cursor over the images for credit information.


