Study identifies 15 US metro regions as leaders in transportation innovation & performance

Posted February 25, 2011 at 1:27PM
A new report released this week by NRDC's Smarter Cities project identifies 15 US metropolitan regions as leading exemplars for transportation policy and practice. The study, created in collaboration with the Center for Neighborhood Technology, compared and profiled regions based on such factors as public transit availability, use and cost; household automobile ownership and use; and innovative, sustainable transportation programs.
The 15 metro regions identified as 'Smarter Cities' for transportation include:
- Seven large regions (greater than 1 million people): Boston, Chicago, Philadelphia, Portland (OR), New York, San Francisco, and Washington, DC.
- Four medium-sized regions (250,000-1 million people): Boulder-Longmont (CO), Honolulu (HI), Jersey City (NJ), and New Haven (CT).
- Four smaller regions (fewer than 250,000 people): Champaign-Urbana (IL); Bremerton (WA); Lincoln (NE); and Yolo (CA).
Alice Henly and Paul McRandle, who developed the study, cite several highlights in a press release:
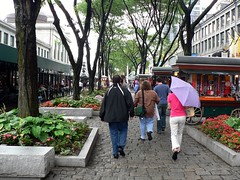
 In downtown Boston, around 65 percent of trips during peak hours are non-motorized due its compactness and walkability. The city has also adopted a Complete Streets initiative to give fair access to pedestrians, cyclists and public transit along with motorists.
- Philadelphia has selectively expanded the city's public transit system in certain neighborhoods to increase residents' access to fresh food.
- Boulder, Colorado has built paved pathways along Boulder Creek that allow walkers and bikers to travel up to 52 miles without ever having to cross traffic. (Warning: through no fault of the trail, I once crashed on one of them.)
- Washington DC's Capital Bikeshare program has made more than 1,100 bikes available at solar-powered docking stations throughout DC and Arlington County, Virginia, across the Potomac River.
- About 98 percent of Jersey City, New Jersey residents live within a half mile of public transit; only 60 percent own or have access to a car. (Sadly, this may have as much to do with poverty as with access to other modes.)
The transportation study is the second to be released by Smarter Cities, which aims to inspire cities, municipalities and regions nationwide by recognizing and profiling what leading metropolitan regions are doing to become more efficient, sustainable, and livable.
I found the profile of Lincoln, Nebraska especially interesting. CNT found that Lincoln residents drive less, on average, than those of any other small metro region, and the Smarter Cities staff learned that transit usage has risen 16 percent in the last six years, in part because of a specific incentive program targeted at low-income riders. In addition, due to a compact regional footprint that increases regional accessibility (allowing shorter driving trips as well as opportunities to choose other modes), the average length of a commuting trip in the Nebraska capital is only 17 minutes, far below the national average. Lincoln also has a clean-fuels initiative for its bus fleet and progressive zoning that encourages transit-oriented development, walkability, and complete streets.
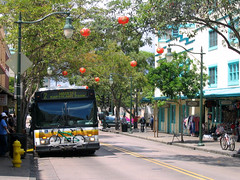
New Haven has the highest percentage of commuters who walk to work of any city in New England, as well as a substantial number who bicycle. It also has a robust transit system, a new complete streets design manual, and a federally assisted plan to replace a substantial portion of an elevated freeway running through downtown with a modern urban boulevard. Honolulu, for its part, is also embracing clean bus technology, along with a new, 20-mile rail transit system.
The data underlying the 15 cities' transportation profiles were drawn from the US Census and from CNT's Housing + Transportation Affordability Index, which quantifies average vehicle miles driven, transportation costs, and transportation carbon emissions per household by location. As I have written before, CNT’s impressive data bank and GIS-based mapping allows users to see at a glance the environmental and financial impacts of sprawl, and the benefits of smart locations in addressing both. The more sprawling the neighborhood – the more spread out, the greater its distance from job centers, the less transit availability and fewer conveniences within walking distance – the greater its transportation costs. This goes for cities and regions, too.
Data points considered in the analysis are set out below. Readers familiar with CNT’s good work will recognize the organization's influence:
 Number and Percent of Households with Access to Transit
 - Number and Percent of Households Living in Neighborhoods with Access to Good Levels of Transit
- Number and Percent of Commuters Using Transit to Get to Work
- Average Auto Ownership
- Average Household Annual Vehicle Miles Traveled
- Number and Percent of Households Living in Neighborhoods Where Transportation Costs are Less than or Equal to 15% of Household Income
- Average Annual and Monthly Household Transportation Costs
- Number and Percent of Block Groups Where Transportation Costs are Less than or Equal to 18% of Area Median Income
- 2009 Largest Percentage of Workers Commuting By Public Transportation
- 2009 Smallest Percentage of Workers Commuting By Driving Alone
- Change In Share of Workers Commuting By Pubic Transportation, 2000-2009
There is a full discussion of study methodology here. And there are tables indicating the rankings of various regions studied in these categories here.
For next time, if it were up to me, I might rely less on one-time snapshot data and more on data indicating how regional performance on key factors is changing over time.  Looking at whether a region’s mileage driven per capita has decreased (or not) in the last decade, for example, is likely to reveal the effects of policy and innovation in a way that snapshot data cannot. In addition, personally I would not count auto ownership. I understand that others feel differently, and it is certainly relevant when one is measuring how much an average household spends on transportation. But I would argue that, if a household drives, say, 15,000 miles per year, the environment is only marginally concerned with whether its occupants use one, two, or three cars to do so.
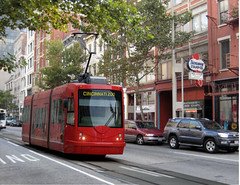
I also would have loved to have seen more discussion of the exciting streetcar initiatives that are going on in so many places, perhaps in a sidebar (it does come up in the discussion of Portland and Washington, DC), such as Cincinnati, or a profile of the exciting work going on in Charlotte around street design and walkable development around that city’s light rail stops.
But no one report can do everything to please everyone, and Alice, Paul and others put a tremendous amount of effort into this one. Readers looking for a compilation of excellent case study examples of good transportation practices could do themselves a favor by starting here.
Move your cursor over the images for credit information.