Using LEED-ND to identify good locations for smart, green development

Posted July 27, 2010 at 1:30PM
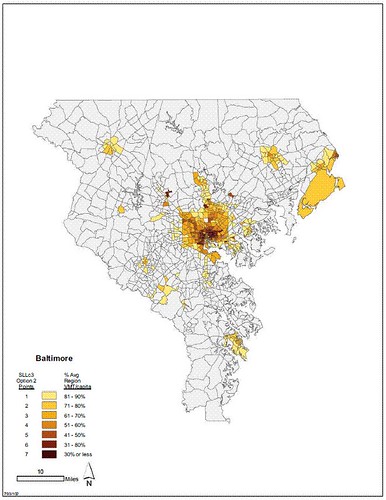
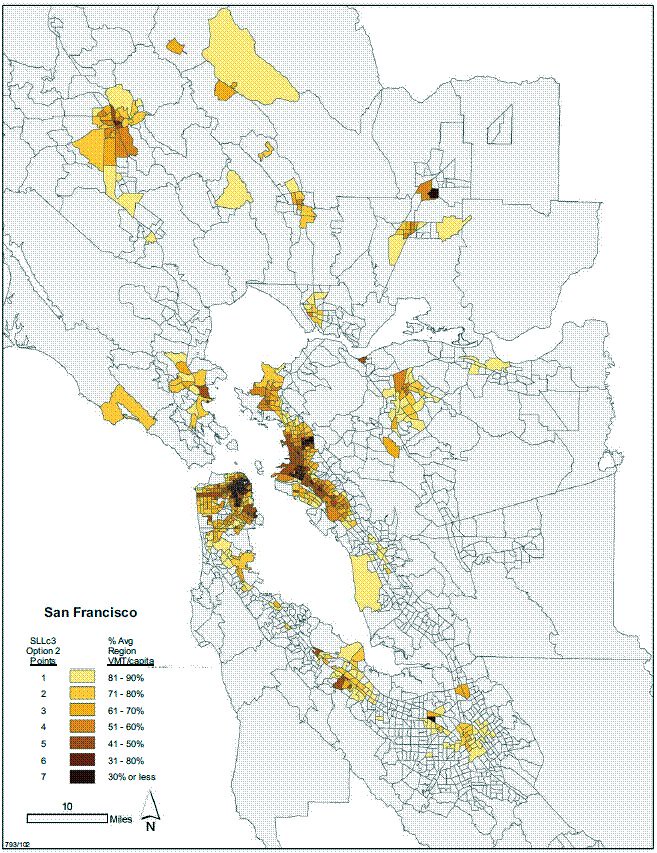
Above is a GIS-coded map of metropolitan Baltimore, a region approximately 70 miles north to south and, at its widest point, about 60 miles east to west. Below are similar maps of the San Francisco Bay Area and metropolitan Portland, Oregon. The colored portions in each indicate preferred locations for smart, green development using criteria from LEED for Neighborhood Development.
There is now heightened interest in using LEED-ND not just as a structured program for evaluating and rewarding worthy development proposals, but also as a template for policy decisions. This has been spurred in part by HUD secretary Shaun Donovan’s announcement that his agency intends to use location criteria from LEED-ND to assist in evaluating potential HUD grantmaking. Since many of us involved in constructing the program have hoped all along that public officials would borrow from the system’s criteria and methodology for various purposes, all this is great news.
It has led to frenzied questioning by some in the field, however, as to what “using LEED-ND” to identify good locations should mean, exactly. (Never mind that some of us just spent eight years sorting that out. Most people aren't yet familiar with the system.) Ad hoc work groups have formed; meetings have been held and scheduled; concepts have been developed and floated.
Enter the ever-analytical and creative Eliot Allen of Criterion Planners (Eliot has been involved with LEED-ND almost as long as I have) to remind us that it really may not be all that complicated. The three GIS maps shown here, all developed by Criterion, apply a single LEED-ND criterion (SLLc3 for you ND nerds, and you know who you are), which awards credit points for the following:
“Locate the project within a region served by a metropolitan planning organization (MPO) and within a transportation analysis zone where the current annual home-based vehicle miles traveled (VMT) per capita does not exceed 90% of the average of the metropolitan region. The research must be derived from household transportation surveys conducted by the MPO within ten years of the date of submission for LEED for Neighborhood Development certification. Additional credit may be awarded for increasing levels of performance, as indicated . . .”
In other words, if a location reduces the amount of driving its residents do, on average, compared to its metro region as a whole, it is worth crediting. If it beats the regional average by a lot, it is worth crediting with more points (up to a maximum of seven).
More specifically, residents of the locations shown in color on Criterion's maps drive no more than 90 percent, on average, of the vehicle miles traveled by an average person in the region as a whole; the darker the color, the lower the driving rate. To illustrate, if the average person in the greater Baltimore region drives 30 miles per day (hypothetical amount), the average person in one of the marked locations drives 27 miles or fewer. In the darkest portions of the map, the average person would drive 9 miles or fewer. Since all metro regions are required by federal transportation law to maintain these data, they are generally available to an analyst who knows what she is doing.
Note that these superior locations include not just about everywhere in central cities, but also some suburban locations: for example, they include sites (among others) in and near Santa Rosa, Concord, Walnut Creek, San Rafael, and Palo Alto in the San Francisco Bay Area; Timonium, Reisterstown and Havre de Grace outside Baltimore; McMinnville, Vancouver (WA) and Gresham outside Portland. Much of the area shown in gray comprises rural land, small towns and low-density sprawl where relatively poor accessibility leads to high rates of driving and consequent emissions. (As an added benefit, the metro Portland map also shows how that region’s urban growth boundary has done a decent job of containing the spread of development.)
Eliot recommends this kind of analysis to assist "place-based planning," which makes a ton of sense for an agency like HUD, as well as for the environment and for conserving infrastructure costs. It's a great corollary to the Center for Neighborhood Technology's Housing + Transportation Affordability Index, which identifies locations where residents can reduce household expenses associated with transportation. I bet the best sites identified under each methodology match up very well.
 That locations certifiable under LEED-ND are likely to reduce driving compared to average locations is also being suggested by an analysis of development projects certified under the LEED-ND pilot. Undertaken by Reid Ewing of the University of Utah along with Meghan Bogearts, Michael Greenwald, and Ming Zhang, and pending publication (Reid was kind enough to allow me to view a preliminary copy), the study applied sophisticated transportation modeling to 12 certified projects. The analysis predicts average trip lengths, showing that average vehicle miles traveled per household trip from the group of 12 will likely amount to only 29 to 69 percent of their regional averages, depending on the particular project. The researchers believe this is due to the superior regional accessibility of the studied LEED-ND locations. Eight of the locations also have a predicted walk mode share (the percentage of all trips made by walking) above ten percent, which is outstanding.
Move your cursor over the images for credit information.


