New data show how transit corridors reduce traffic, increase walking

Posted August 17, 2011 at 1:27PM
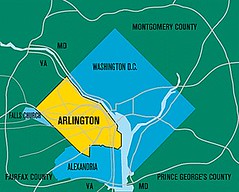
New data from Arlington County, Virginia, provide an in-depth look at how a jurisdiction known for great planning has leveraged excellent transit service and transit-oriented development into efficient transportation performance.
Arlington, just across the Potomac from Washington, DC, is often cited for good reason as a smart growth success story: I reported on the inner suburb back in 2008, in a two-part series (here and here) noting how Arlington had added over 24,000 homes and 17 million square feet of office and retail space with little discernible effect on automobile traffic. (More recent reports put the latter number at closer to 25 million square feet.) This was done primarily by concentrating growth in corridors well-served by transit, while leaving intact the county’s beautiful neighborhoods of single-family homes.
The story can now be updated. Writing in The Washington Post, Robert Thomson reports that planners have been collecting and analyzing data to discern how people move, not just how vehicles do, and looking at all trips, not just commuting. He cites a number of findings from a new travel-habits study conducted for the county by LDA Consulting, including these:
- 22 percent of Arlington households do not own a car, compared with 16 percent for the metro region as a whole;
 Only 40 percent of daily trips are made by driving alone;
- 16 percent of all trips, and 23 percent of in-county trips, are made on foot;
- “Arlington residents make more total trips per day than the regional average – 3.9 versus 3.5 — but they travel fewer miles per day than the regional average, because their trips are shorter: 15.8 miles versus 25.6 miles.” (This is my personal favorite statistic, because it illustrates the power of regional accessibility, or Arlington’s relatively central location within the metro area as a whole.)
Additional data can be found in the county’s presentation to a development forum earlier this year:
- Arlington provides 173,000 rail and 24,000 daily transit trips;
- 30 percent of trips into Arlington from Washington and
 40 percent of trips into Arlington from suburban Montgomery County, Maryland are made by transit (the number is closer to 20 percent for trips from other metro area suburban counties);
 - Fully 45 percent of trips from Arlington into DC are made on transit;
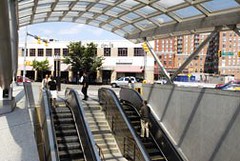
- 64-87 percent of travelers using Arlington’s Metrorail stations (depending on the station) arrive on foot;
- The number of people walking to Arlington’s Ballston Metro station drops sharply as walking distance increases beyond a quarter-mile (that may be influenced somewhat by the fact that population density is concentrated close to the station);
- Metrorail usage is much higher during rush-hour periods;
 Bus ridership is spread among a range of ages, incomes, and ethnicities.
If you consider that, in the US as a whole, only about 5 percent of commuting trips and only about 2 percent of total trips are made by public transit, and well over 70 percent of work trips are made by driving alone, Arlington’s numbers begin to look very impressive indeed. Add that the national share of trips made by walking is around 9 percent, compared to Arlington’s 16 percent, and the story only gets richer. Smart transportation, smart land use, and a good location within a metro region get results.
Publication of the blog will be reduced (but not stopped) while I am on vacation, until after Labor Day.
Move your cursor over the images for credit information.

